Image Details
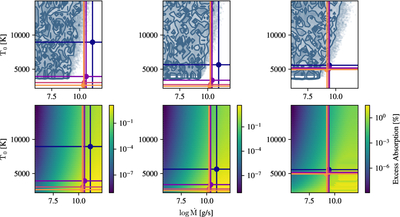
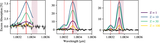
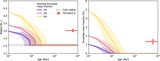
Caption: Figure 4.
Top row: posterior probability distribution for log ﹩\dot{M}﹩ and T0 for TOI-4010 b (first panel), TOI-4010 c (second panel), and TOI-4010 d (third panel). The contours indicate the 1σ, 2σ, and 3σ levels for the distributions. The pyTPCI solar metallicity-predicted mass loss rates and estimated outflow temperatures are shown as blue circles (nominal XUV flux of stellar spectrum), purple circles (XUV flux reduced by a factor of five), pink circles (XUV flux reduced by a factor of ten), and orange circles (XUV flux reduced by a factor of 15). Bottom row: p-winds predicted excess absorptions corresponding to our MCMC analysis for a 50 × 50 grid sampling our ﹩\dot{M}﹩–T0 prior range.
Other Images in This Article

Copyright and Terms & Conditions
© 2025. The Author(s). Published by the American Astronomical Society.