Image Details
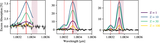
Caption: Figure 2.
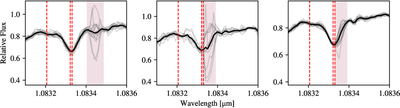
In-transit spectra of TOI-4010 b (first panel), TOI-4010 c (second panel), and TOI-4010 d (third panel) in the stellar rest frame. Gray lines are the in-transit spectra throughout the night. The average in-transit spectrum is shown in black. Red vertical dashed lines denote the wavelengths of the three helium lines. The red shaded regions correspond to the location of a telluric OH line and are masked in our analysis.
Other Images in This Article

Copyright and Terms & Conditions
© 2025. The Author(s). Published by the American Astronomical Society.
Copyright ©
2025 Astronomy Image Explorer. All Rights Reserved.