

Image Details
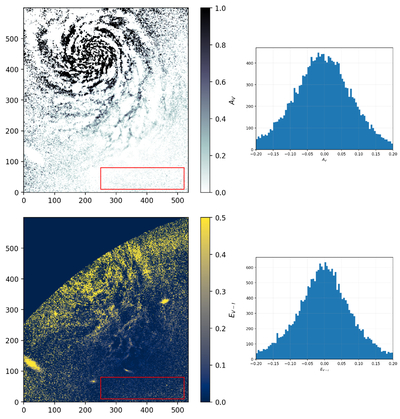
Caption: Figure 13.
Regions of predominantly noise for AV (top) and EV−F090W = AV − AF090W (bottom), shown to demonstrate the distribution of these respective values when no expected signal is present. The chosen areas of noise (in red) are well outside the outer arms of VV 191b and on the back side of the background elliptical galaxy, VV 191a. The right column shows the distribution of the low-S/N pixels. Both show a near-Gaussian distribution centered at zero. It is calculated that ﹩{A}_{V}^{{\mathrm{mean}}}=-0.01﹩, ﹩{\sigma }_{{A}_{V}}=0.05﹩, ﹩{E}_{V-{{\rm{F}}}090{{\rm{W}}}}^{{\mathrm{mean}}}=-0.003﹩, and σEV−F090W = 0.09 for these selected regions shown in red. Thus, the lower-limit threshold used in the Monte Carlo simulation, such that AV and EV−F090W ≤ 0.1 must equal 0.1, is a reasonable choice.
Other Images in This Article
Show More
Copyright and Terms & Conditions
© 2025. The Author(s). Published by the American Astronomical Society.

