Image Details
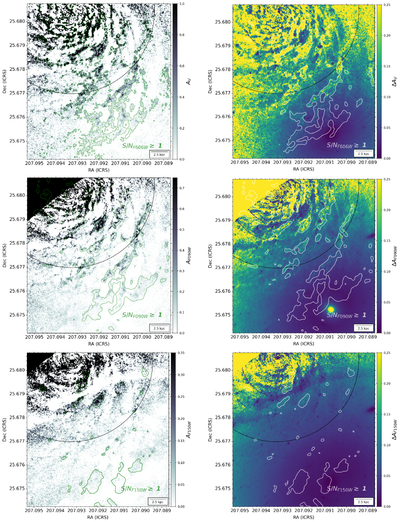
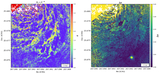
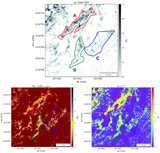
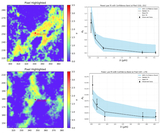
Caption: Figure 3.
Attenuation maps (Aλ; left side) and their respective uncertainties (ΔAλ; right side). Top row: attenuation calculated from the HST F606W filter, whose reference wavelength is 0.606 μm. Middle row: attenuation calculated from the JWST F090W filter, whose reference wavelength is 0.90 μm. Bottom row: attenuation calculated from the JWST F150W filter, whose reference wavelength is 1.50 μm. All maps are overlaid (green for Aλ and white for ΔAλ) with their respective S/N maps (that is, the HST F606W and JWST F090W and F150W filters each have their own S/N maps, not given in this paper) as a contour such that S/Nλ ≥ 1. All contour maps are smoothed over (3 pixels across). Also overlaid in black is the Petrosian radius (RP = 12 kpc). These attenuation structures are well outside the stellar disk.
Other Images in This Article
Show More
Copyright and Terms & Conditions
© 2025. The Author(s). Published by the American Astronomical Society.