Image Details
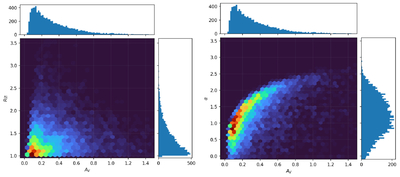
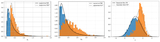
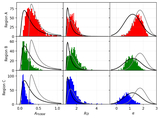
Caption: Figure 7.
Left: the reddening slope ﹩{R}_{\widetilde{VI}}﹩ plotted against AV throughout all pixels that meet the criteria mentioned in Section 4.2. Right: the NIR attenuation power-law index α plotted against AV. Both plots are two-dimensional hexagonal-binned histogram density plots. To ensure high confidence that the reported pixels are sufficiently backlit by the background galaxy, additional thresholds for the galactocentric radius, R ≥ 8 kpc, and AV, AF090W ≥ 0, are imposed.
Other Images in This Article
Show More
Copyright and Terms & Conditions
© 2025. The Author(s). Published by the American Astronomical Society.
Copyright ©
2026 Astronomy Image Explorer. All Rights Reserved.