Image Details
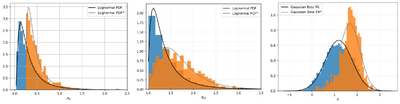
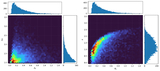
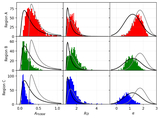
Caption: Figure 6.
Density histograms of AV (left), ﹩{R}_{\widetilde{VI}}﹩ (middle), and α (right) within the overlap of VV 191b with the restrictions as mentioned in Figure 7. The best log-normal fits of AV and ﹩{R}_{\widetilde{VI}}﹩ and a Gaussian fit of α are overlaid in black. The distributions of the dust parameters with an even stricter threshold, AV > 0.25 and S/NF090W ≥ 3, are shown in orange, with their best-fit probability density function (pdf) fits overlaid in gray. The mean and the standard error of the distributions (not the fits) of ﹩{R}_{\widetilde{VI}}﹩ and α are given in Table 2.
Other Images in This Article
Show More
Copyright and Terms & Conditions
© 2025. The Author(s). Published by the American Astronomical Society.
Copyright ©
2026 Astronomy Image Explorer. All Rights Reserved.