Image Details
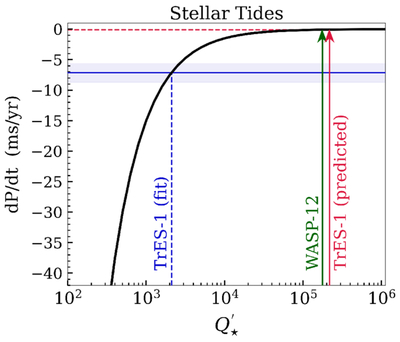
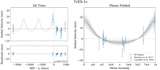
Caption: Figure 8.
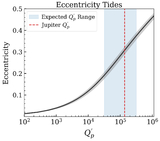
The expected orbital period derivative for TrES-1 b under the assumption that stellar tides dominate its orbital evolution, as a function of the modified stellar quality factor ﹩{Q}_{\star }^{{\prime} }﹩. The solid blue horizontal line represents the best-fit orbital decay rate for TrES-1 b, with the shaded region indicating the corresponding 68% credible interval. Three specific values of ﹩{Q}_{\star }^{{\prime} }﹩ are highlighted: (1) the value derived from the best-fit orbital decay rate using Equation (17), (2) the predicted value from the tidal forcing period of the system using Equation (18), and (3) the value inferred for WASP-12, an HJ decaying at ∼30 ms yr−1, from I. Wong et al. (2022).
Other Images in This Article

Show More
Copyright and Terms & Conditions
© 2025. The Author(s). Published by the American Astronomical Society.