Image Details
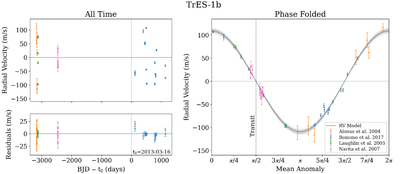
Caption: Figure 3.
RV data and best-fit orbital model for TrES-1 b. Top left: RV measurements over time, with data points shifted by the systemic RV and observation times shifted to the reference time, t0. Bottom left: residuals obtained by subtracting the best-fit RV model from the data. Right: phase-folded RV measurements plotted against mean anomaly, with 300 random samples from the model posterior shown in gray to represent model uncertainty. Data sources are color coded as indicated in the legend.
Other Images in This Article

Show More
Copyright and Terms & Conditions
© 2025. The Author(s). Published by the American Astronomical Society.
Copyright ©
2026 Astronomy Image Explorer. All Rights Reserved.