Image Details
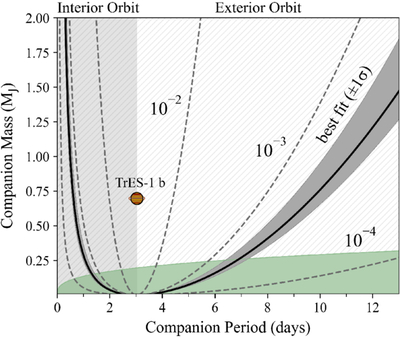
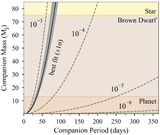
Caption: Figure 6.
Mass vs. orbital period for a hypothetical companion planet that is driving apsidal precession. The solid black line and surrounding gray shaded region correspond to the best-fit precession rate and 68% credible interval, ﹩\dot{\omega }=0.0005{8\,}_{-0.00009}^{+\,0.00016}﹩rad E−1. The dashed gray lines show additional precession rates for comparison (10−2, 10−3, and 10−4 rad E−1). The location of TrES-1 b is marked, dividing the plot into interior and exterior orbits. The green shaded area shows the region where the RV amplitude, Kc, is within the residuals of the TrES-1 b orbit fit (i.e., Kc ≪ 30, see Figure 3), which rules out the remaining parameter space (hatched).
Other Images in This Article

Show More
Copyright and Terms & Conditions
© 2025. The Author(s). Published by the American Astronomical Society.