Image Details
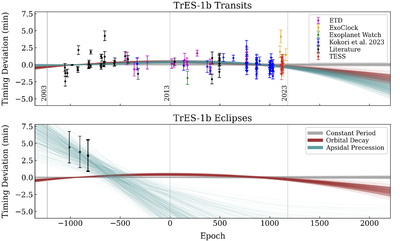
Caption: Figure 2.
Transit (top) and eclipse (bottom) timing variations for TrES-1 b. Each data point represents the difference between an observed time and the expected midpoint from the best-fit constant-period, circular orbit model. The plot shows 300 random samples from the weighted posterior distributions of the joint model fits—which included RV data—for the constant-period, orbital decay, and apsidal precession models.
Other Images in This Article

Show More
Copyright and Terms & Conditions
© 2025. The Author(s). Published by the American Astronomical Society.
Copyright ©
2026 Astronomy Image Explorer. All Rights Reserved.