Image Details
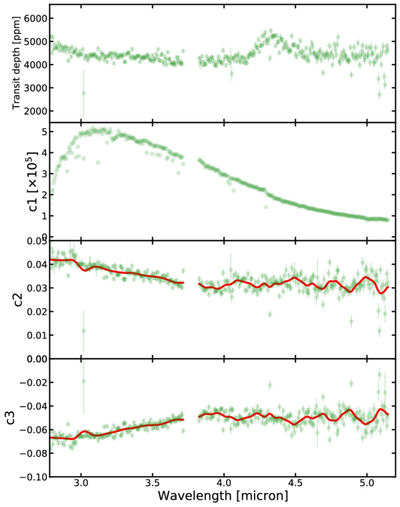
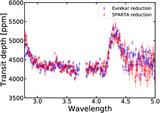
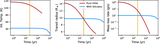
Caption: Figure C2.
Transmission spectrum of V1298 Tau b (upper panel) and fitted baseline quadratic polynomial coefficients (middle and lower panels), defined in Equation (C1). This transmission spectrum has been derived from an empirical model fit (Appendix C) to spectroscopic light curves derived from 10 pixel bins on the 1D stellar spectra from Eureka! data reduction (Appendix A). The light-curve models are described in Equation (C1). The model includes a quadratic polynomial function to model the low-frequency stellar baseline variability, a double exponential function to model the flare, a sinusoidal function to model the postflare oscillations, and a batman model for the planet transit. The solid red lines show a smoothed function, obtained by applying a Gaussian filter on the observed c2 (linear coefficient) and c3 (quadratic coefficient) values. The transmission spectrum derived using this approach exhibits prominent H2O, CH4, and CO2 absorption features, but shows significant scatter and multiple outliers (>5σ compared to neighboring data points). We find that c2 and c3 appear correlated with the transit depth: outliers in the transmission spectrum correspond to outliers in the c2 and c3. c2 and c3 show a strong wavelength dependence for NRS1, and are relatively wavelength independent for NRS2. The smoothed c2 and c3 coefficients are used for the data-driven detrending of the spectroscopic light curves in the second iteration of light-curve fits described in Appendix C.
Other Images in This Article
Show More
Copyright and Terms & Conditions
© 2025. The Author(s). Published by the American Astronomical Society.