Image Details
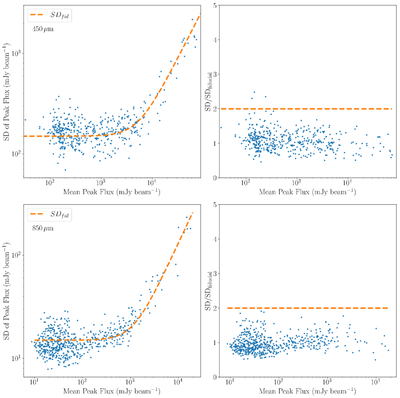
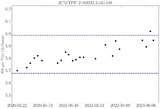
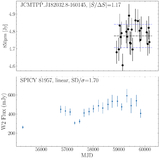
Caption: Figure 3.
Left panels: scatter plot of measured SD of peak brightness vs. measured mean peak brightness for all 450 μm (top row) and 850 μm sources (bottom row) in M17. The orange dashed curve denotes the fiducial SD, SDfid, for the expected uncertainty in the peak brightness of JCMT-SCUBA2 sources. Right panels: the same as the left panels, but for the normalized SD of peak brightness (SD/SDfid). Here, the dashed orange line separates out the potential stochastic variables.
Other Images in This Article
Show More
Copyright and Terms & Conditions
© 2025. The Author(s). Published by the American Astronomical Society.
Copyright ©
2025 Astronomy Image Explorer. All Rights Reserved.