Image Details
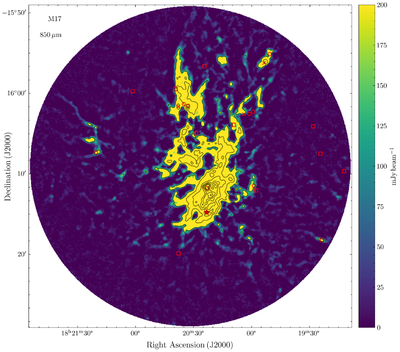
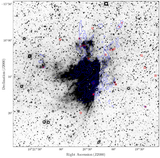
Caption: Figure 8.
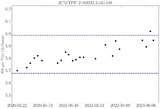
The spatial distribution of mid-IR and submillimeter variable candidates classified in this work, overlaid on the 850 μm map of M17. The contours of 850 μm continuum emission are in levels of 0.15, 0.6, 1.8, 3.6, 6.0, 9.0, 1.26, and 1.68 Jy beam−1. Circles, squares, and “X” represent different classification types for YSOs, i.e., Class I, Class II, and uncertain, respectively. The star symbol represents the linear variable at 850 μm (JCMTPP_J182023.2).
Other Images in This Article
Show More
Copyright and Terms & Conditions
© 2025. The Author(s). Published by the American Astronomical Society.
Copyright ©
2025 Astronomy Image Explorer. All Rights Reserved.