Image Details
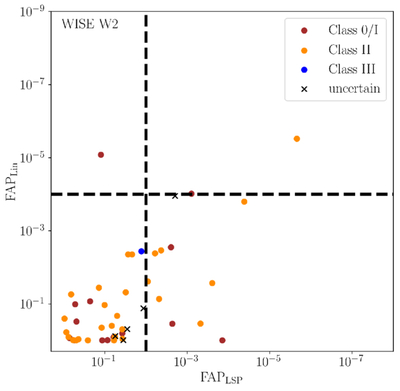
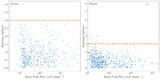
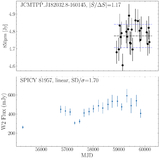
Caption: Figure 7.
Comparison of the FAPs for linear and periodic fits for the same YSO as in Figure 6. The vertical dashed line represents a FAP value of 10−4 for a linear fit, while the horizontal dashed line represents a FAP value of 10−2 for an LSP fit.
Other Images in This Article
Show More
Copyright and Terms & Conditions
© 2025. The Author(s). Published by the American Astronomical Society.
Copyright ©
2025 Astronomy Image Explorer. All Rights Reserved.