Image Details
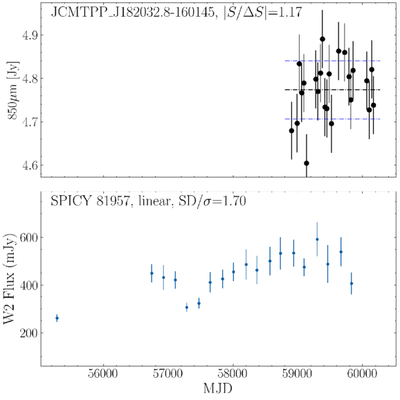
Caption: Figure 10.
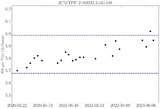
JCMT Transient Survey 850 μm (top) and NEOWISE W2 light curves (bottom) of SPICY 81957. The black and blue dashed lines in the JCMT Transient Survey light curve represent the mean peak flux and ±1σ boundaries.
Other Images in This Article
Show More
Copyright and Terms & Conditions
© 2025. The Author(s). Published by the American Astronomical Society.
Copyright ©
2025 Astronomy Image Explorer. All Rights Reserved.