Image Details
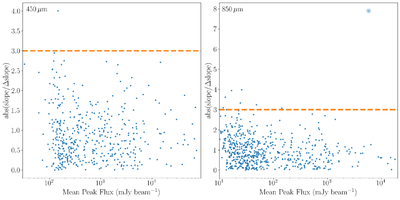
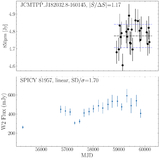
Caption: Figure 4.
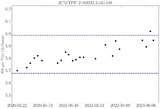
The distribution of the absolute value of the best-fit peak brightness slope S ratioed to its uncertainty ΔS vs. mean peak flux for the 450 (left) and 850 μm (right) sources in M17. The dashed horizontal line in both panels indicates where ∣S/ΔS∣ = 3, indicating the threshold for linear variability reliability as defined by D. Johnstone et al. (2018). Bright 450 and 850 μm sources with ∣S/ΔS∣ > 3 are highlighted by circles. In the 850 μm plot, only one bright source, JCMTPP J182023.2, has a value of ∣S/ΔS∣ much higher than the threshold.
Other Images in This Article
Show More
Copyright and Terms & Conditions
© 2025. The Author(s). Published by the American Astronomical Society.
Copyright ©
2025 Astronomy Image Explorer. All Rights Reserved.