Image Details
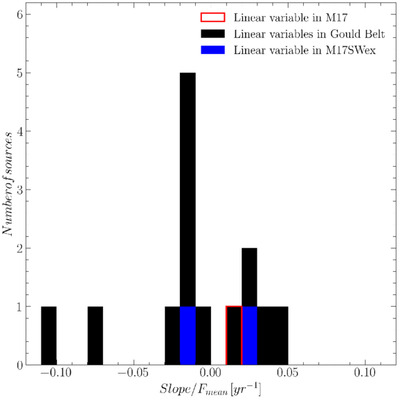
Caption: Figure 15.
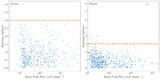
Histograms of the fractional slopes determined by linear fit. The black and blue histogram shows the slopes of linear variables in the Gould belt and M17 SWex recovered by the JCMT Transient Survey, respectively.
Other Images in This Article
Show More
Copyright and Terms & Conditions
© 2025. The Author(s). Published by the American Astronomical Society.
Copyright ©
2025 Astronomy Image Explorer. All Rights Reserved.