Image Details
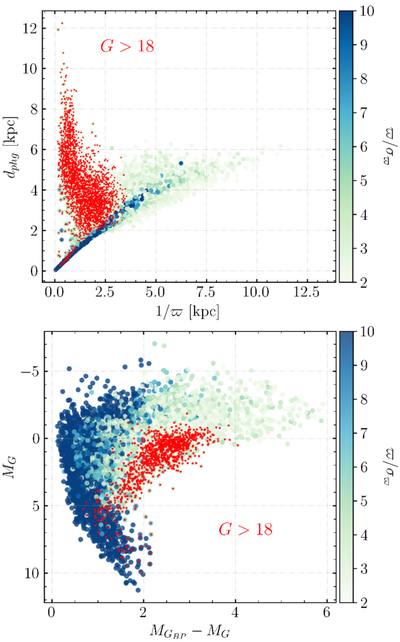
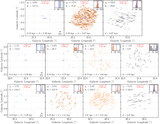
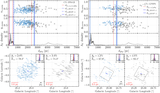
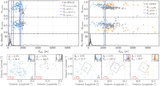
Caption: Figure 14.
Top: comparison between the inverse parallax and the photogeometric distances from C. A. L. Bailer-Jones et al. (2021). Bottom: color–magnitude diagram from Gaia EDR3 photometry (Gaia Collaboration et al. 2021). Both panels present all high-quality Gaia measurements (i.e., ϖ/σϖ > 2, RUWE < 1.4, and ϖ > 0) in the region C5, colored by the parallax SNR, which saturates at 10. The red points represent faint stars with G > 18.
Other Images in This Article
Show More
Copyright and Terms & Conditions
© 2025. The Author(s). Published by the American Astronomical Society.
Copyright ©
2025 Astronomy Image Explorer. All Rights Reserved.