Image Details
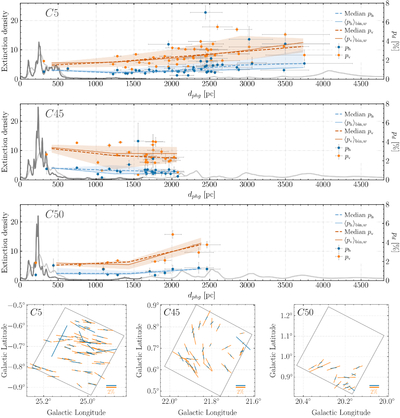
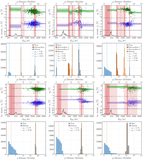
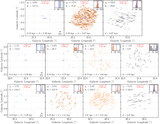
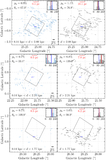
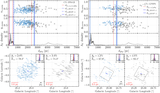
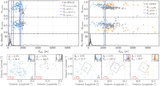
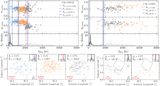
Caption: Figure 3.
Optical (the orange dots) and NIR (the blue dots) debiased polarization degree as a function of the distance for stars common to both surveys in regions C5, C45, and C50 (from top to bottom, respectively). The dashed orange and blue lines show the median polarization degree, and the solid lines show the weighted mean per distance bin. The shaded areas represent the 68% confidence intervals. The polarization (right axis) is compared with optical extinction per parsec (AV pc–1, left axis) from J. L. Vergely et al. (2022), at 10 pc (the solid gray curve) and 50 pc (the solid light-gray curve) resolution. The extinction density units are 10−3 mag pc−1. Bottom row: polarization maps for stars common to IPS-GI (orange) and GPIPS (blue) in the same regions. The gray squares mark the approximate limits of the IPS-GI field of view.
Other Images in This Article
Show More
Copyright and Terms & Conditions
© 2025. The Author(s). Published by the American Astronomical Society.