Image Details
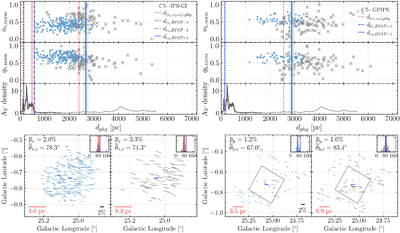
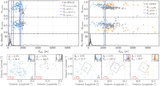
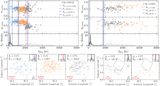
Caption: Figure 8.
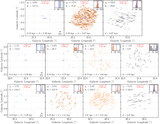
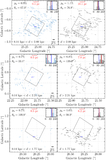
GMM results with optical (left) and NIR (right) polarization in C5. Top row: Stokes parameters q(v, h) and u(v, h) as a function of distance. The different colors and symbols represent the groups identified by the GMM. The extinction density with units of 10−3 mag pc−1 from J. L. Vergely et al. (2022), at 10 pc (dark gray) and 50 pc (light-gray) resolution, is included in the bottom panel for comparison. The blue vertical lines show the location of the polarizing clouds identified with BISP-1; the red dashed vertical lines are the corresponding corrected distance (see Section 5.1). Bottom row: polarization orientation of stars in each cluster. The insets show the polarization angle distributions and the mean values (the red line). The black rectangle in the right panels indicates the approximate location of the IPS-GI field of view. The dark-blue pseudovectors represent the average orientation of the magnetic field within the region as observed by Planck.
Other Images in This Article
Show More
Copyright and Terms & Conditions
© 2025. The Author(s). Published by the American Astronomical Society.