Image Details
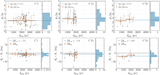
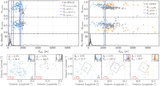
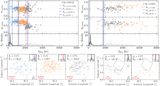
Caption: Figure 6.
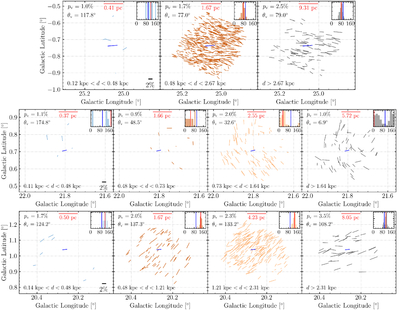
Polarization maps of star groups located behind each BISP-1 layer in C5 (top), C45 (middle), and C50 (bottom). The insets in the top right show the distribution of the polarization angle observed along with the median value (the red line) and the average magnetic field orientation from Planck (the blue line, also shown as a pseudovector in the center of the map). The median polarization properties of the components obtained with BISP-1 are shown in the top left of the panels (also see Table 1). The red ruler shows the actual spatial scale measured for an angular scale of ﹩0\mathop{.}\limits^{^\circ }1﹩ at the distance of the clouds.
Other Images in This Article
Show More
Copyright and Terms & Conditions
© 2025. The Author(s). Published by the American Astronomical Society.