Image Details
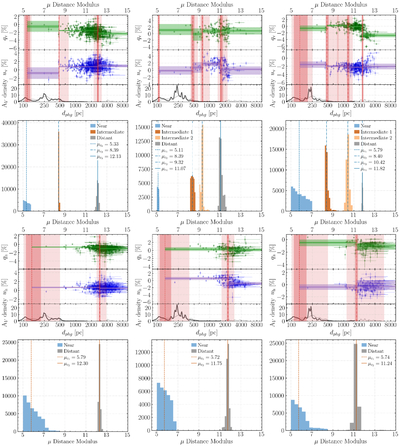
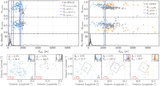
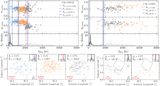
Caption: Figure 5.
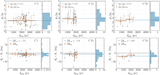
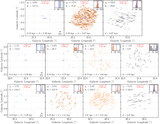
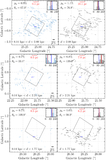
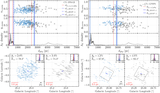
Best solutions of the polarization decomposition using BISP-1 with optical (first two rows) and NIR (last two rows) polarization observations in the regions of C5 (left), C45 (middle), and C50 (right). The first and third rows show the Stokes parameters q(v, h) and u(v, h) as a function of the distance modulus calculated using the inverse parallax. The red vertical lines and shaded areas represent the cloud median distances and their 1σ and 2σ confidence intervals. Similarly, the horizontal solid lines and shaded areas represent the LOS-integrated median q(v, h) (green) and u(v, h) (purple) and their 1σ and 2σ uncertainties for each group of stars behind the polarizing layers. The bottom panels show the extinction per distance unit (10−3 mag pc−1) profiles from J. L. Vergely et al. (2022) at 10 pc (gray) and 50 pc (light-gray) resolution; the distance of the profiles is on a logarithmic scale. The second and fourth rows show the posterior distributions of the inverse parallax for each cloud modeled. The vertical dashed lines show the median values.
Other Images in This Article
Show More
Copyright and Terms & Conditions
© 2025. The Author(s). Published by the American Astronomical Society.