Image Details
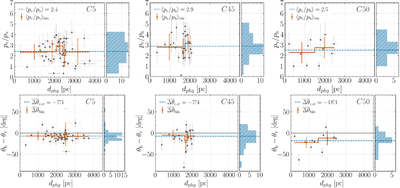
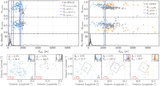
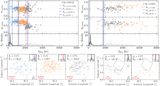
Caption: Figure 4.
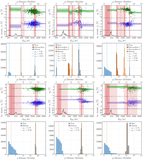
Top row: ratio of the degree of polarization in the optical to NIR as a function of distance of stars in common between the IPS-GI and GPIPS observations in each region. Bottom row: systematic difference between the NIR and optical polarization angles as a function of the distance in each region. The horizontal blue dashed line is the mean value of the distribution shown in the right-side panels. The solid dark-orange lines represent the mean and standard deviation per distance bin. The weighted circular mean and standard deviation were used in the case of the angular difference.
Other Images in This Article
Show More
Copyright and Terms & Conditions
© 2025. The Author(s). Published by the American Astronomical Society.
Copyright ©
2025 Astronomy Image Explorer. All Rights Reserved.