Image Details
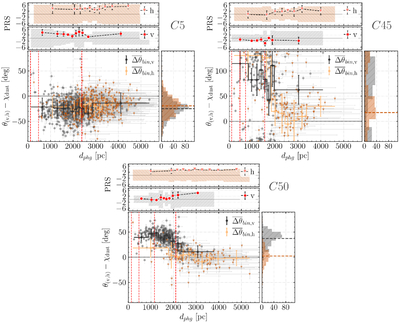
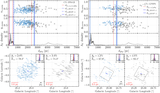
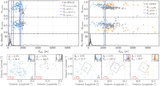
Caption: Figure 13.
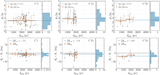
Magnetic field orientation difference between the starlight polarization and polarized thermal dust emission from Planck Collaboration XII et al. (2020) as a function of distance in C5 (top left), C45 (top right), and C50 (bottom). Due to the π ambiguity, the angular difference range in C45 was shifted by 50° for visualization. For each region, the bottom panels show the weighted circular mean difference per distance bin using the NIR (the solid light-orange) and optical (the solid black) observations. The error bars are the weighted circular standard deviation on each distance bin. The vertical red dashed lines show the corrected distance of the polarizing clouds found with BISP-1. The right-side panels show the angular difference distributions with the circular means (the horizontal dashed lines). The two top panels show the projected Rayleigh statistic (PRS; Equation (6)) per distance bin along with the weighted error. The gray and orange shaded areas represent the values between the maximum and minimum PRS per distance bin (see explanation in Section 5.5).
Other Images in This Article
Show More
Copyright and Terms & Conditions
© 2025. The Author(s). Published by the American Astronomical Society.