Image Details
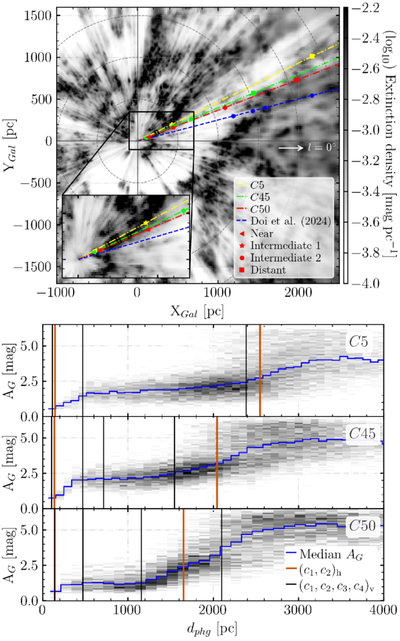
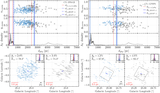
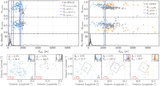
Caption: Figure 12.
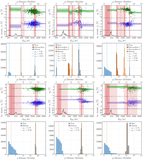
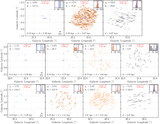
Top: LOSs of C5 (in yellow), C45 (in green), and C50 (in red) drawn over the extinction density XY plane from J. L. Vergely et al. (2022) at 10 pc (d < 1.5 kpc) and 25 pc (d > 1.5 kpc) resolutions. The markers indicate the adjusted positions of optical polarization clouds. Y. Doi et al. (2024)’s results for the Sagittarius Arm are displayed in blue for comparison. Bottom panels: G-band extinction from Gaia Collaboration et al. (2023) as a function of the photogeometric distance for all Gaia stars within C5 (top), C45 (middle), and C50 (bottom). The solid blue line is the median AG per distance bin. The vertical lines show the polarizing screens identified with BISP-1 using the optical (black) and NIR (orange) observations, corrected for the bias in the inverse parallax–distance relation (Section 5.1).
Other Images in This Article
Show More
Copyright and Terms & Conditions
© 2025. The Author(s). Published by the American Astronomical Society.