Image Details
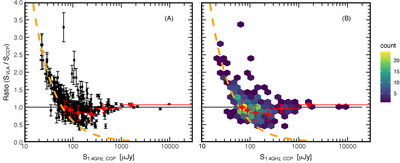
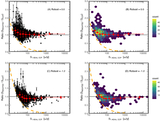
Caption: Figure 9.
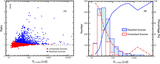
The ratio of flux densities of the VLA-COSMOS sources with respect to those of the CHILES Con Pol sources as a function of CHILES Con Pol 1.4 GHz flux density. The left panel shows a comparison of CHILES Con Pol with VLA-COSMOS (E. Schinnerer et al. 2010) and the right panel shows the same data in a hexbin plot to include the source density information better. Red diamonds in the left panel indicate the weighted mean in each bin, same as in Figure 8. The orange dashed curves represent the boundaries of the flux density ratios, determined by the sensitivity limit (60 μJy at 5σ) for the VLA-COSMOS survey.
Other Images in This Article
Copyright and Terms & Conditions
© 2025. The Author(s). Published by the American Astronomical Society.