Image Details
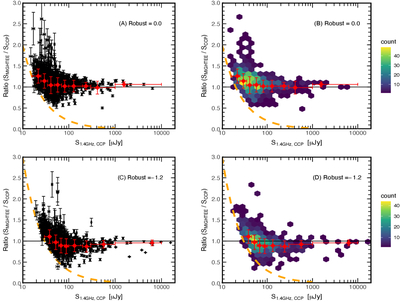
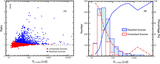
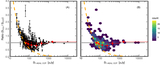
Caption: Figure 8.
The ratio of flux densities of between the MIGHTEE and CHILES Con Pol catalogs as a function of the CHILES Con Pol 1.4 GHz flux density. Panels (A) and (B) show comparisons of the CHILES Con Pol sources with the R = 0 MIGHTEE catalog, while panels (C) and (D) present the comparisons with the R = −1.2 MIGHTEE catalog. Panels (A) and (C) illustrate the ratio of flux densities with their uncertainties, and panels (B) and (D) show the same data as hexbin plots. In panels (A) and (C), red symbols indicate the weighted mean in each bin with uncertainties, and horizontal lines show the range of bins. The orange dashed curves for the R = 0 catalog (top rows) show that our estimated catalog completeness is 20 μJy (∼12σ) while it is 30 μJy (5σ) for the R = −1.2 catalog (bottom rows).
Other Images in This Article
Copyright and Terms & Conditions
© 2025. The Author(s). Published by the American Astronomical Society.