Image Details
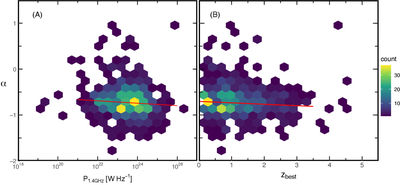
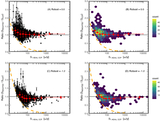
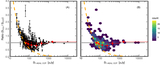
Caption: Figure 6.
Hexbin plots (2D histograms) of the radio spectral index as a function of 1.4 GHz power (panel (A)) and zbest (panel (B)). The red line indicates the linear regression computed by a robust linear model (lmRob function) in R (R Core Team 2013).
Other Images in This Article
Copyright and Terms & Conditions
© 2025. The Author(s). Published by the American Astronomical Society.
Copyright ©
2025 Astronomy Image Explorer. All Rights Reserved.