Image Details
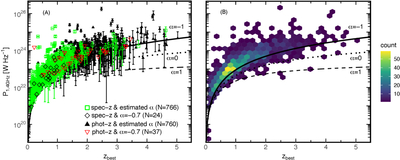
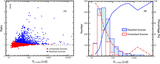
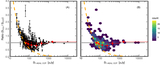
Caption: Figure 7.
Derived 1.4 GHz power of individual sources is shown as a function of redshift in the left panel while the same distribution is shown as a hexbin plot in the right panel to reflect the source density better. In the left panel, green open squares and black open diamonds represent spec-z sources with and without an estimated spectral index, respectively. Black-filled triangles and red upside-down triangles represent phot-z sources with and without an estimated spectral index. The three lines delineate 7σ detection limits for the three different assumed spectral indices: α = −1 (solid), 0 (dotted), and +1 (dashed).
Other Images in This Article
Copyright and Terms & Conditions
© 2025. The Author(s). Published by the American Astronomical Society.