Image Details
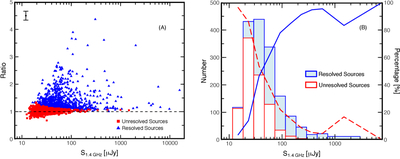
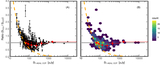
Caption: Figure 4.
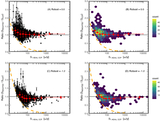
The ratio of integrated flux density to peak flux density of the sources detected in the CHILES Con Pol survey (left panel) and histograms and fractions of unresolved and resolved sources (right panel) as a function of flux density. (A) The resolved sources based on the integrated to peak flux ratio are shown with blue filled triangles, while the unresolved sources are shown with red filled squares. The horizontal black dashed line indicates the unity ratio. The typical (median) uncertainty in this ratio (σ = 0.18) and 10% flux density are shown in the upper left of the plot. (B) Histograms of unresolved sources (blank red bars) and resolved sources (filled light blue bars) are shown with a bin size of ﹩{\rm{\Delta }}\mathrm{log}\,{S}_{1.4\mathrm{GHz}}=0.2﹩. The percentage of unresolved sources (red dashed line) and resolved sources (blue solid line) are also shown.
Other Images in This Article
Copyright and Terms & Conditions
© 2025. The Author(s). Published by the American Astronomical Society.