Image Details
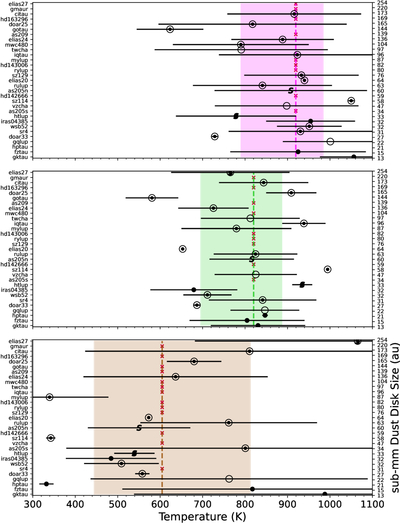
Caption: Figure 9.
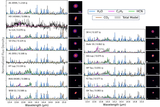
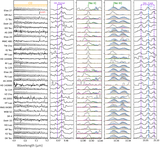
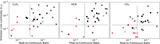
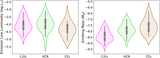
Retrieved temperatures from slab model fits to C2H2 (top, magenta), HCN (middle, green), and CO2 (bottom, brown) emission lines from JDISCS sources in order of decreasing submillimeter disk size from top to bottom of each panel. Vertical dashed lines and shaded regions represent the sample median ±1σ, with red x’s along the median lines denoting nondetections for each molecule. Black markers identify the submillimeter substructures, as listed in Table 2. The C2H2 and HCN temperatures are generally consistent, while the CO2 is cooler.
Other Images in This Article
Show More
Copyright and Terms & Conditions
© 2025. The Author(s). Published by the American Astronomical Society.
Copyright ©
2025 Astronomy Image Explorer. All Rights Reserved.