Image Details
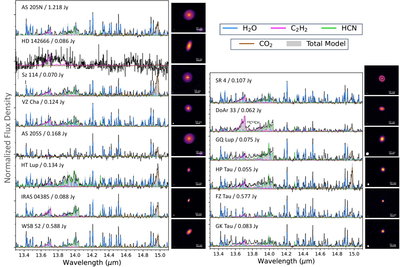
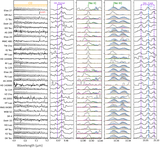
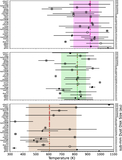
Caption: Figure 4.
MRS continuum-subtracted spectra of C2H2 (magenta), HCN (green), H2O (blue), and CO2 (brown) emission lines between 13.6 and 15.3 μm from JDISCS sources with submillimeter dust sizes r < 60 au. ALMA images are shown at the right (S. M. Andrews et al. 2018; F. Long et al. 2018, 2019; F. Long et al. 2025, in preparation), in order of submillimeter dust disk size from largest (top left; AS 205N, r ∼ 60 au) to smallest (bottom right; GK Tau, r ∼ 13 au). Slab model fits to the molecular emission lines are overplotted on the spectra, corresponding to the best-fit parameters and upper limits reported in Tables 5, 6, 7, and A1. 13C12CH2 emission is also detected in the spectrum of DoAr 33 (M. J. Colmenares et al. 2024).
Other Images in This Article
Show More
Copyright and Terms & Conditions
© 2025. The Author(s). Published by the American Astronomical Society.