Image Details
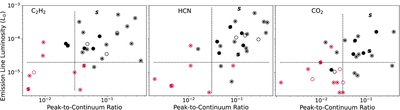
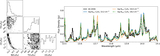
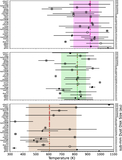
Caption: Figure 8.
Emission-line luminosities from best-fit slab models (integrated between 12 and 16 μm) vs. peak-to-continuum values from the slab models and fit to the continuum, with marker styles indicating the spatially resolved submillimeter structures in Table 2. Targets in the upper-right quadrant show the clearest molecular gas detections, and we report nondetections (red markers) when peak-to-continuum ratios are <0.03 or emission-line luminosities are smaller than ﹩\mathrm{log}L\lt -5.1\,{L}_{\odot }﹩ (black, dashed lines). While disks with resolved submillimeter dust cavities show C2H2 and HCN emission lines, none of these sources have CO2 emission.
Other Images in This Article
Show More
Copyright and Terms & Conditions
© 2025. The Author(s). Published by the American Astronomical Society.