Image Details
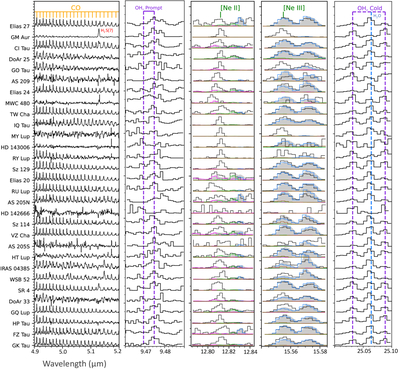
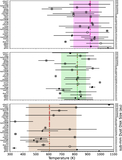
Caption: Figure 5.
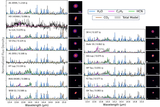
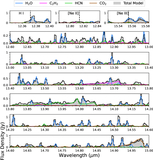
Gallery of rovibrational CO, OH, [Ne II], and [Ne III] emission lines from 30/31 JDISCS sources (HD 163296 is excluded due to poor data quality). The spectra are in order from largest to smallest submillimeter disk size, with representative slab models of H2O overplotted on the data surrounding the [Ne II] and [Ne III] emission lines (following A. Banzatti et al. 2025). C2H2 and HCN slab models are shown as well, with the same color scheme as in Figure 3.
Other Images in This Article
Show More
Copyright and Terms & Conditions
© 2025. The Author(s). Published by the American Astronomical Society.
Copyright ©
2025 Astronomy Image Explorer. All Rights Reserved.