Image Details
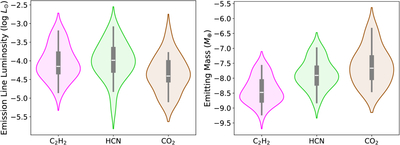
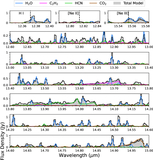
Caption: Figure 10.
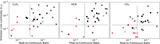
Emission-line luminosities (left) and emitting masses (right) integrated from slab model fits to C2H2, HCN, and CO2 between 12 and 16 μm in JDISCS sources. Despite spanning a limited range in stellar masses, the targets display at least an order of magnitude variation in mid-infrared luminosity and mass of each molecule. Violin widths represent the number of disks with detections of each molecule, such that narrower violins correspond to lower detection rates.
Other Images in This Article
Show More
Copyright and Terms & Conditions
© 2025. The Author(s). Published by the American Astronomical Society.
Copyright ©
2025 Astronomy Image Explorer. All Rights Reserved.