Image Details
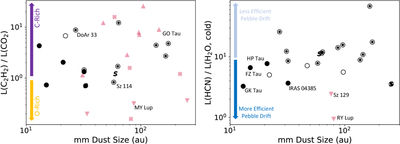
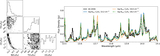
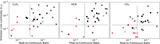
Caption: Figure 17.
Left panel: ratios of C2H2 to CO2 integrated emission-line luminosities vs. submillimeter dust disk sizes from Table 2. Red markers denote lower limits for disks where CO2 was not detected (VZ Cha, TW Cha, Sz 129, MWC 480) and upper limits for disks where C2H2 was not detected (AS 205S, MY Lup, Elias 27), and red X symbols denote disks where neither molecule was detected (RY Lup). Right panel: ratios of HCN integrated emission-line luminosities and cold 23.85 μm H2O emission from A. Banzatti et al. (2025) vs. submillimeter dust disk size. Black markers are used to identify submillimeter substructures, as listed in Table 2.
Other Images in This Article
Show More
Copyright and Terms & Conditions
© 2025. The Author(s). Published by the American Astronomical Society.