Image Details
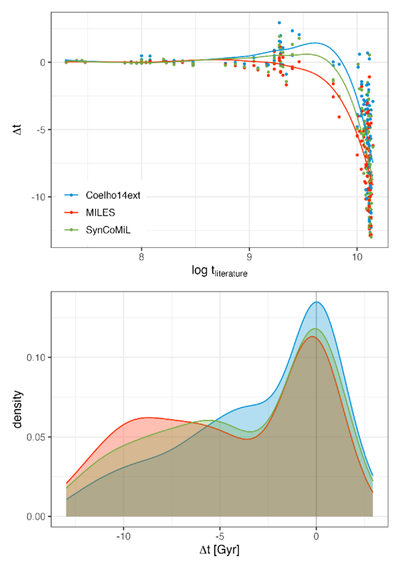
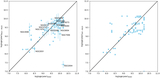
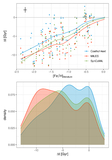
Caption: Figure 9.
Behavior of Δt (age derived from spectral fitting minus age from isochrone fitting) for our entire sample. Isochrone ages are from A. P. Milone et al. (2023) supplemented by the compilation in G. Gonçalves et al. (2020, Table 1). The top panel shows Δt as a function of literature age. The tendency lines are obtained from LOESS. The bottom panel shows the density distribution of Δt. In both panels, the color code identifies the stellar library that was employed in modeling the SSP templates.
Other Images in This Article
Copyright and Terms & Conditions
© 2025. The Author(s). Published by the American Astronomical Society.
Copyright ©
2026 Astronomy Image Explorer. All Rights Reserved.