Image Details
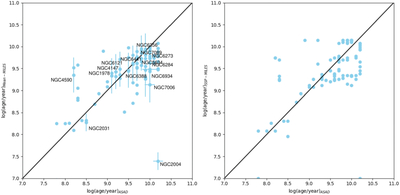
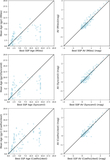
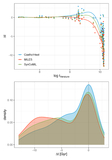
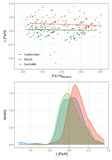
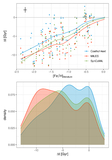
Caption: Figure 7.
Comparison between the age inferred by STARLIGHT (y-axis) and ASAD (x-axis). In the left panel the vertical axis shows the LWA from a multipopulation fit, whereas in the right panel and the horizontal axis of both panels, we show the age of the best-fitting single SSP.
Other Images in This Article
Copyright and Terms & Conditions
© 2025. The Author(s). Published by the American Astronomical Society.
Copyright ©
2026 Astronomy Image Explorer. All Rights Reserved.