Image Details
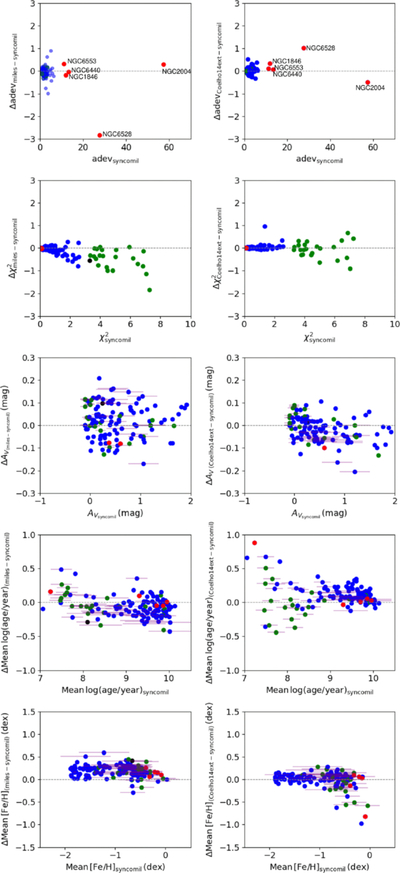
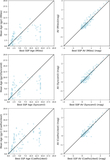
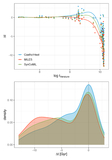
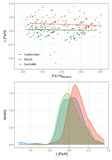
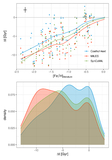
Caption: Figure 3.
Comparison of results for adev, χ2, log(LWA), light-weighted [Fe/H], and Av obtained from multipopulation fits. Left column: difference in derived values between MILES and SynCoMiL SPS models. Right column: difference in derived values between Coelho14ext and SynCoMiL SPS models. Dots are color-coded according to the goodness of fit: blue and green dots represent fits with χ2 ≤ 3 and χ2 > 3 for both SPS models, respectively. The black dots correspond to fits with χ2 ≤ 3 for one SPS model and >3 for the other.
Other Images in This Article
Copyright and Terms & Conditions
© 2025. The Author(s). Published by the American Astronomical Society.
Copyright ©
2026 Astronomy Image Explorer. All Rights Reserved.