Image Details
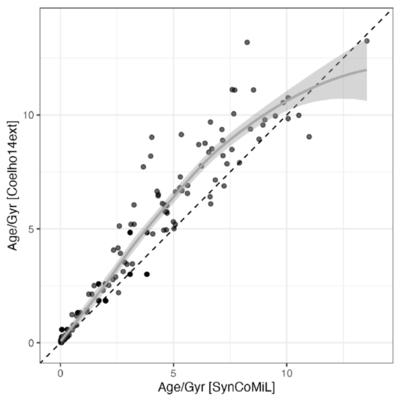
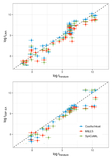
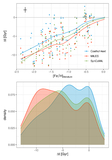
Caption: Figure 6.
Comparison between the age derived using SPS models based on the Coelho14ext (y-axis) vs. the SynCoMiL (x-axis) stellar libraries. Age is shown in a linear scale to highlight the age interval where the comparison deviates more from the 1-to-1 line. The gray line represents the locally estimated scatterplot smoothing (LOESS) fit to the data, and the shaded area shows its confidence interval.
Other Images in This Article
Copyright and Terms & Conditions
© 2025. The Author(s). Published by the American Astronomical Society.
Copyright ©
2026 Astronomy Image Explorer. All Rights Reserved.