Image Details
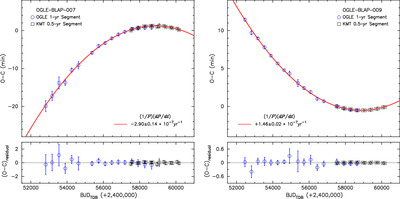
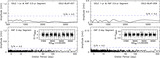
Caption: Figure 8.
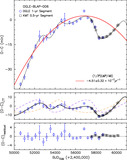
O − C diagram for the pulsation periods of OGLE-BLAP-007 (left) and OGLE-BLAP-009 (right). Red lines in the upper panels represent the parabolic fits; the corresponding residuals are shown in the lower panels.
Other Images in This Article
Copyright and Terms & Conditions
© 2025. The Author(s). Published by the American Astronomical Society.
Copyright ©
2026 Astronomy Image Explorer. All Rights Reserved.