Image Details
Caption: Figure 1.
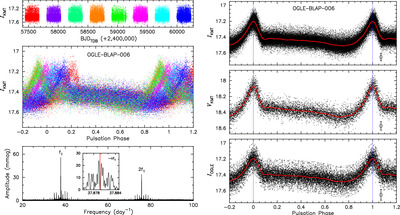
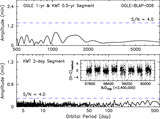
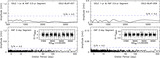
Light variations of OGLE-BLAP-006. (Left) Top panel displays the KMTNet I-band data, spanning eight years from 2016, with distinct colors for each year. The phase diagram in the middle reveals notable annual changes in the phase of maximum brightness, indicating pulsation timing variations. The pulsation phases were computed using the primary frequency f1 from the Fourier amplitude spectrum in the bottom panel. The inset offers a close-up view of prewhitening results around the frequency f1, marked by a vertical red line, highlighting prominent side peaks due to the timing variations. −nf1 represents the prewhitening process that subtracts light variations linked to f1 and its harmonics. (Right) Phase diagrams corrected for timing variations using the O − C values from Figure 4 are shown for three data sets: from the top, the KMTNet I, V, and OGLE I bands. Red lines represent synthetic fitting curves, with fitting error bars in the bottom right of each panel.
Other Images in This Article
Copyright and Terms & Conditions
© 2025. The Author(s). Published by the American Astronomical Society.