Image Details
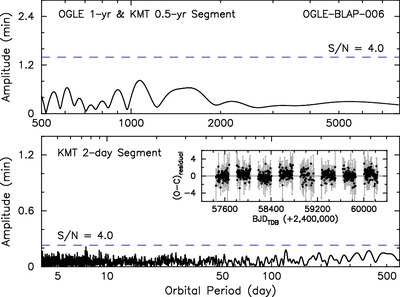
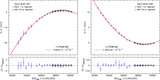
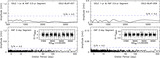
Caption: Figure 5.
Fourier spectra of the O − C residuals for OGLE-BLAP-006. The upper panel shows the spectrum for long orbital periods, from 500 to 8000 days, derived from the residuals for OGLE’s 1.0 yr segments and KMTNet’s 0.5 yr segments. The lower panel displays the spectrum for short-period regions, from 4 to 600 days, obtained using the O − C residuals (shown in the inset) for KMTNet’s 2.0 day segments.
Other Images in This Article
Copyright and Terms & Conditions
© 2025. The Author(s). Published by the American Astronomical Society.
Copyright ©
2026 Astronomy Image Explorer. All Rights Reserved.