Image Details
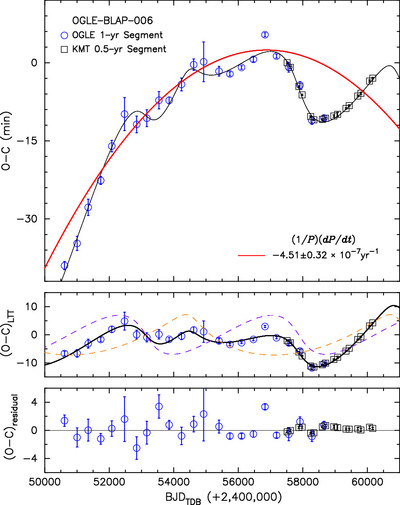
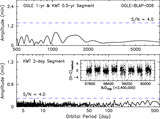
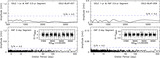
Caption: Figure 4.
O − C diagram for the pulsation period of OGLE-BLAP-006. The OGLE and KMTNet data were divided into 1.0 yr and 0.5 yr segments, respectively, to derive the observed times of maximum light. The red curve in the top panel represents a model parabola with a period change rate of (1/P)(dP/dt) = −4.51 × 10⁻⁷ yr−1. The black curve is of the model that combines the parabola with two LTT terms; the residuals of the model fit are shown in the bottom panel. The middle panel displays the two LTT terms: a blue dashed curve for the inner companion, a red dashed curve for the outer companion, and a thick black curve for their combined model. The error bars in the O − C values, derived from phase errors (σϕ1), were doubled, as recommended by G. Handler et al. (2000).
Other Images in This Article
Copyright and Terms & Conditions
© 2025. The Author(s). Published by the American Astronomical Society.