Image Details
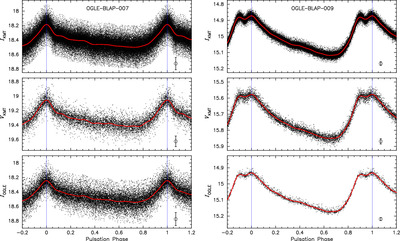
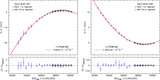
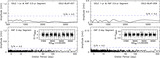
Caption: Figure 6.
Phase diagrams of OGLE-BLAP-007 (left) and OGLE-BLAP-009 (right), corrected for timing variations using the O − C values from Figure 8. The pulsation phases are calculated using the primary frequency f1 obtained from the Fourier spectra in Figure 7. The other descriptions are the same as those for the right panels of Figure 1.
Other Images in This Article
Copyright and Terms & Conditions
© 2025. The Author(s). Published by the American Astronomical Society.
Copyright ©
2026 Astronomy Image Explorer. All Rights Reserved.