Image Details
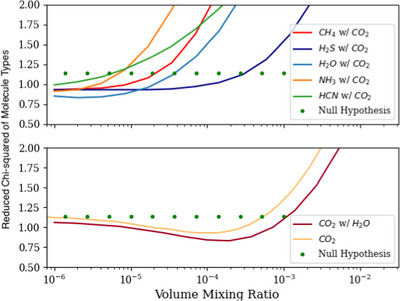
Caption: Figure 9.
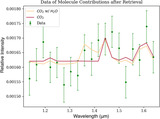
The reduced χ2 when various different molecules are locked to their best-fit values are shown here. In the top panel, all CO2 values are locked at approximately 10−4 VMR while the other molecules are free. In the lower panel, H2O is locked at approximately 10−6 VMR. The value obtained with a flat transmission spectrum is presented in both panels as a dotted line, portraying the scenario in which there is no atmosphere present. This plot presents at which point every combination of molecules becomes a worse assumption than having no atmosphere, i.e., becomes an unrealistic scenario. The models in the lower panel including CO2 provide a significantly better description of the data over a wide range of VMRs.
Other Images in This Article

Show More
Copyright and Terms & Conditions
© 2025. The Author(s). Published by the American Astronomical Society.