Image Details
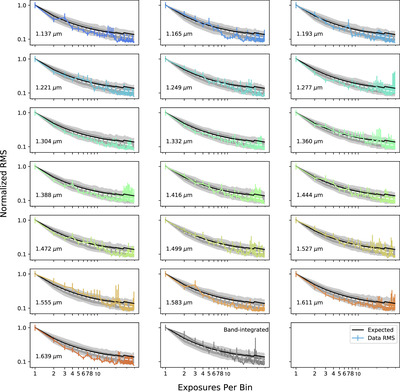
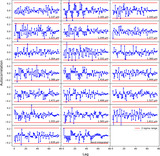
Caption: Figure 5.
Binned rms analysis for each spectral bin, which shows no evidence of red noise. The rms of the data residuals are shown by the colored lines. The solid black line is the theoretical trend from P. Cubillos et al. (2017). The dashed white line is the median value from simulated pure white-noise residuals. The gray regions are the 1 and 2σ ranges for the simulated white-noise residuals, which demonstrates that the observed data are consistent with being largely uncorrelated (e.g., white noise).
Other Images in This Article

Show More
Copyright and Terms & Conditions
© 2025. The Author(s). Published by the American Astronomical Society.
Copyright ©
2025 Astronomy Image Explorer. All Rights Reserved.