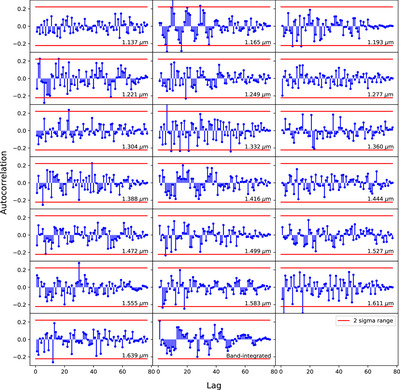
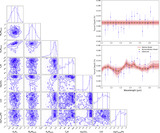
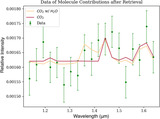
Image Details

Choose export citation format:

The Transmission Spectrum of the Potentially Rocky Planet L 98-59 c

  • Authors: Thomas Barclay, Kyle B. Sheppard, Natasha Latouf, Avi M. Mandell, Elisa V. Quintana, Emily A. Gilbert, Giuliano Liuzzi, Geronimo L. Villanueva, Giada Arney, Jonathan Brande, Knicole D. Colón, Giovanni Covone, Ian J. M. Crossfield, Mario Damiano, Shawn D. Domagal-Goldman, Thomas J. Fauchez, Stefano Fiscale, Francesco Gallo, Christina L. Hedges, Renyu Hu, Edwin S. Kite, Daniel Koll, Ravi K. Kopparapu, Veselin B. Kostov, Laura Kreidberg, Eric D. Lopez, James Mang, Caroline V. Morley, Fergal Mullally, Susan E. Mullally, Daria Pidhorodetska, Joshua E. Schlieder, Laura D. Vega, Allison Youngblood, Sebastian Zieba

Thomas Barclay et al 2025 The Astronomical Journal 169 .

  • Provider: AAS Journals

Caption: Figure 6.

The autocorrelation function of the residuals for each spectral bin. The blue lines and dots show the autocorrelation function as a function of lag, with lag 0 left out for clarity. The solid red lines indicate the 2σ range; autocorrelation values within these lines are not considered significant. The observed data have minimal significant autocorrelation.

Other Images in This Article

Show More

Copyright and Terms & Conditions

Additional terms of reuse