Image Details
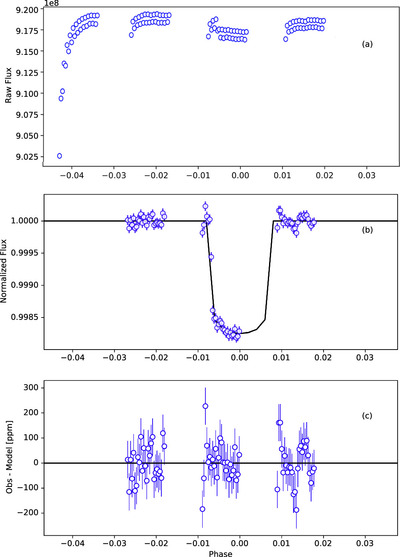
Caption: Figure 2.
Visualization of white-light light-curve fit for the highest-weighted systematic model for L 98-59 c, which demonstrates a good model fit to the observed data. Panel (a) shows the band-integrated light curve. Panel (b) shows the detrended light curve as well as the best-fitting transit model. The instrumental effects and transit model parameters were fit for simultaneously. Panel (c) shows the residuals between the data and the best-fitting model.
Other Images in This Article

Show More
Copyright and Terms & Conditions
© 2025. The Author(s). Published by the American Astronomical Society.
Copyright ©
2025 Astronomy Image Explorer. All Rights Reserved.