Image Details
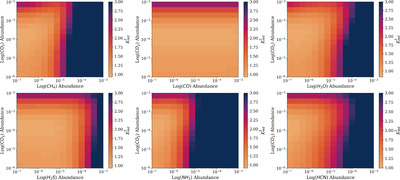
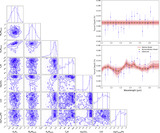
Caption: Figure 8.
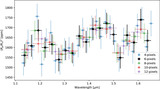
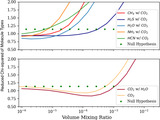
The heat maps above portray the results of a two-molecule atmosphere analysis in terms of VMR. All of the presented analyses have the molecular abundance of CO2 on the y-axis. In the top left we have CH4, in the top middle we have CO, in the top right we have H2O, in the lower left we have H2S, in the lower center is NH3, and in the lower right we have HCN. We retrieved for diameter at each abundance level, and calculated the ﹩{\chi }_{\mathrm{red}}^{2}﹩ to find the best-fit retrieval for diameter. The best-fitting models are found at 10−4 VMR, or 102 ppm, CO2 abundance and extremely low abundances, 10−6 or lower, for other modecules.
Other Images in This Article
Show More
Copyright and Terms & Conditions
© 2025. The Author(s). Published by the American Astronomical Society.